
… lest we forget the late Barton Biggs’ admonition in March of 2000 that “even monkeys fall from trees.”


While US-based AI-related companies drove market returns during the quarter, we were heartened to see the advance broaden well beyond the “Magnificent Seven” to include smaller-cap companies.
Tweedy, Browne Funds Commentary, Q2 2026Despite ongoing geopolitical tensions and a rather fragile cease fire in the Iran/US conflict, the second quarter saw a resumption of the AI inspired advance in US technology stocks. Oil transport began moving again in fits and starts in the Strait of Hormuz which helped to alleviate concerns somewhat about the potential for spiking oil prices and their derivative impact on inflation and interest rates. Global equity prices responded in a relief rally that continued through quarter-end.
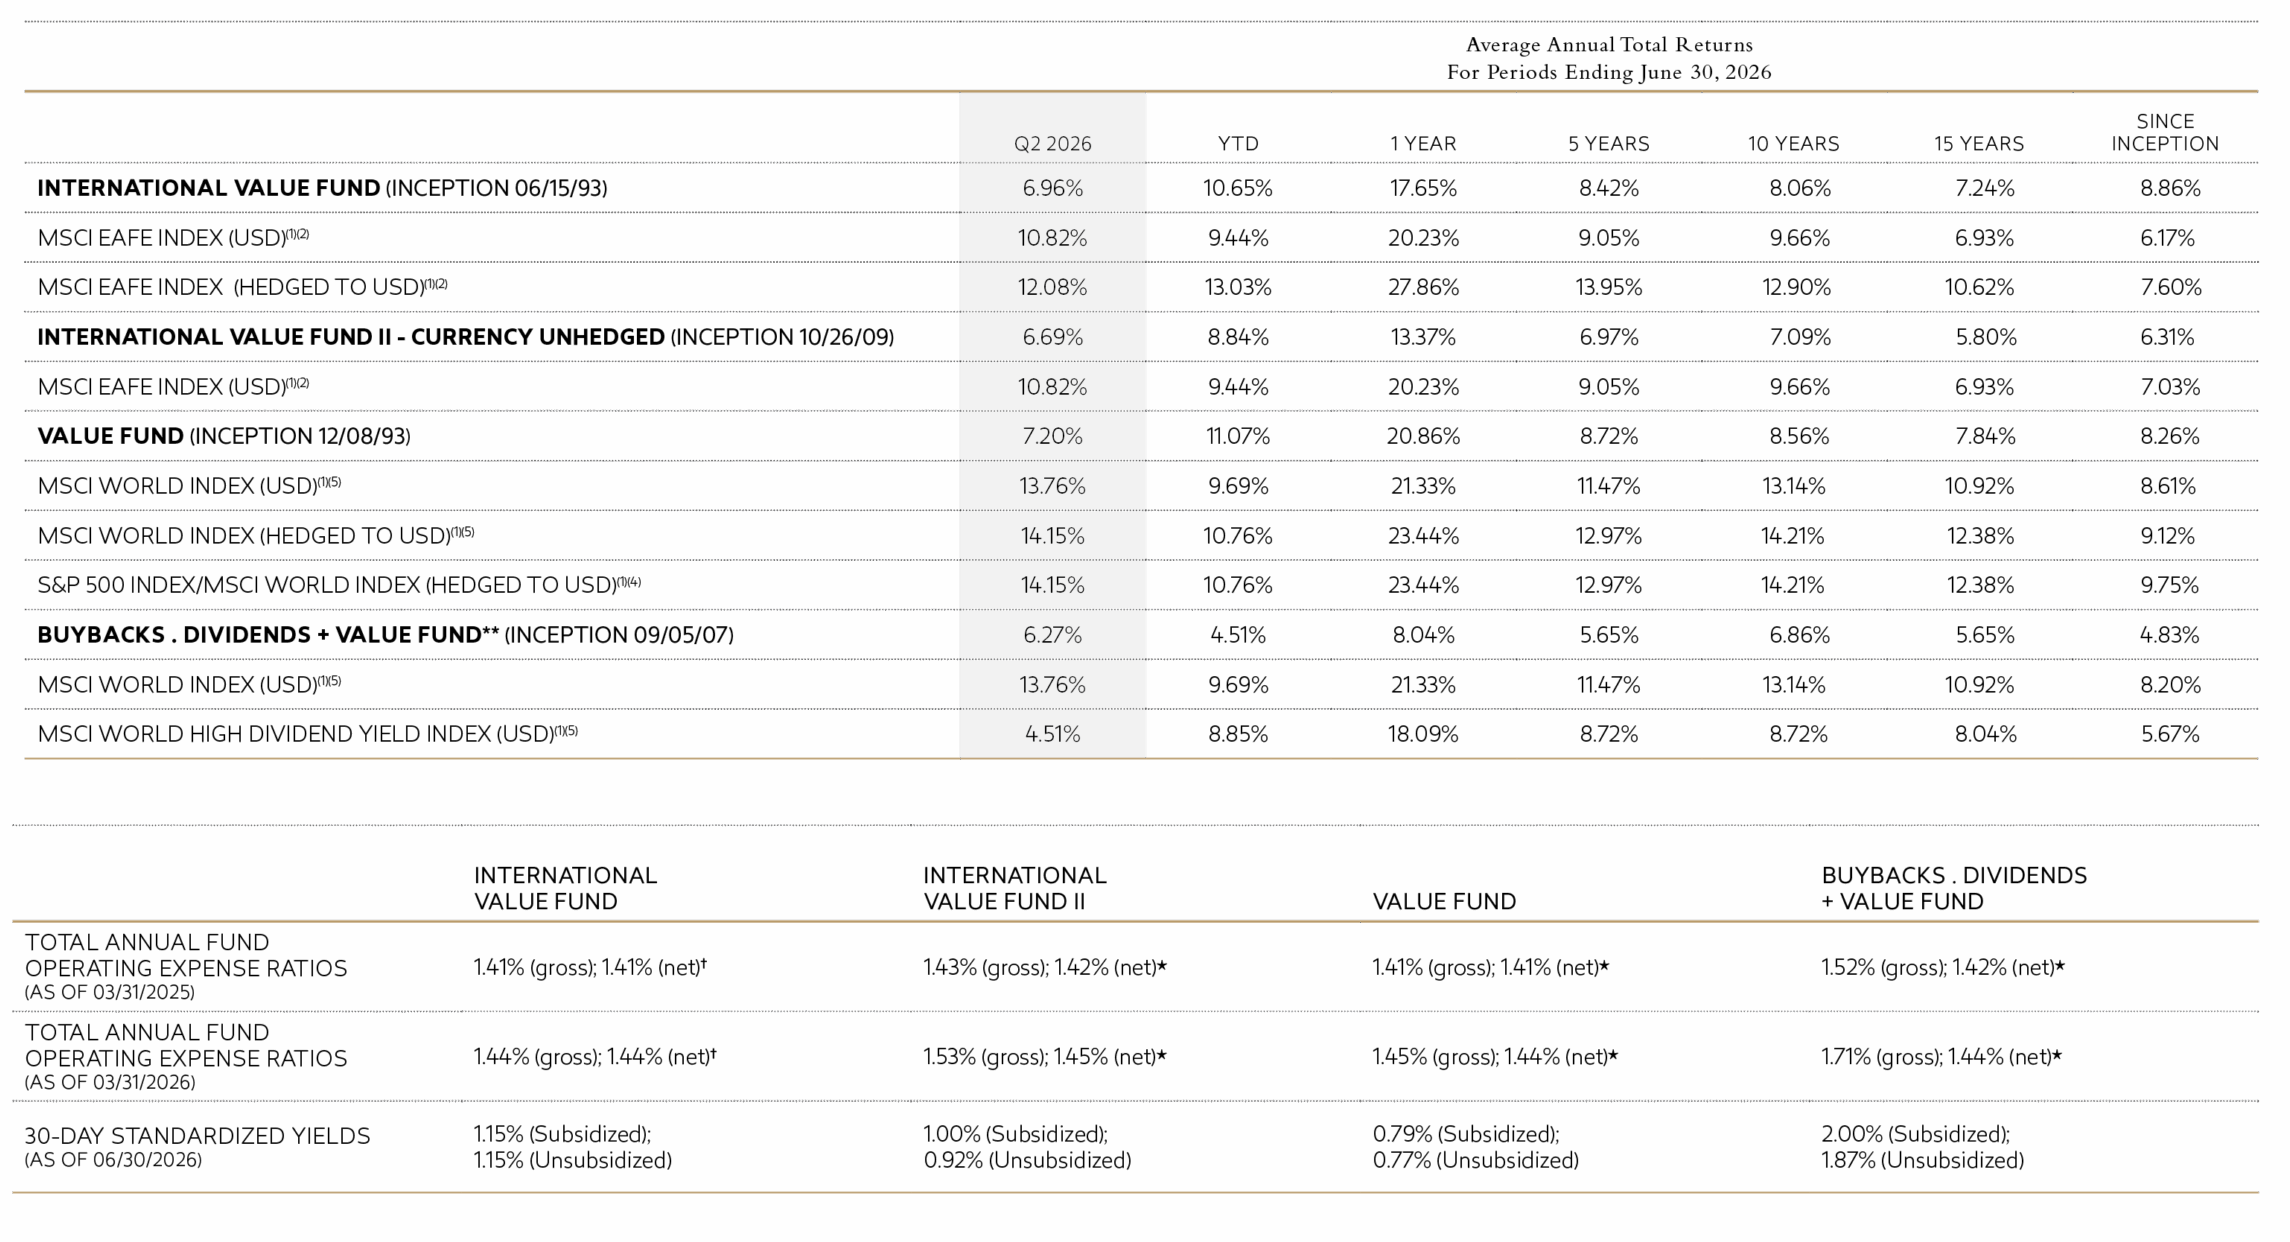
The performance data shown above represents past performance and is not a guarantee of future results. Investment return and principal value of an investment will fluctuate so that an investor’s shares, when redeemed, may be worth more or less than their original cost. Current performance may be higher or lower than the performance data quoted. Please click here (TBGVX), here (TBCUX), here (TWEBX), and here (TBHDX) to obtain performance data that is current to the most recent month-end.
† Tweedy, Browne has voluntarily agreed, effective May 22, 2020 through at least July 31, 2027, to waive the International Value Fund’s fees whenever the Fund’s average daily net assets (“ADNA”) exceed $6 billion. Under the arrangement, the advisory fee payable by the Fund is as follows: 1.25% on the first $6 billion of the Fund’s ADNA; 0.80% on the next $1 billion of the Fund’s ADNA (ADNA over $6 billion up to $7 billion); 0.70% on the next $1 billion of the Fund’s ADNA (ADNA over $7 billion up to $8 billion); and 0.60% on the remaining amount, if any, of the Fund’s ADNA (ADNA over $8 billion). The performance data shown above would have been lower had fees not been waived during certain periods. The Adviser has agreed to waive the Fund’s management fee to the extent of any management fee charged in connection with the portfolio of the Fund’s assets that are allocated to an Affiliated Fund (as defined in the Fund’s Prospectus). Such waiver shall continue until July 31, 2027.
* Tweedy, Browne has voluntarily agreed, effective December 1, 2017 through at least July 31, 2027, to waive a portion of the International Value Fund II’s, the Value Fund’s and the Buybacks . Dividend + Yield Value Fund’s** investment advisory fees and/or reimburse a portion of each Fund’s expenses to the extent necessary to keep each Fund’s expense ratio in line with the expense ratio of the International Value Fund. (For purposes of this calculation, each Fund’s acquired fund fees and expenses, brokerage costs, interest, taxes and extraordinary expenses are disregarded, and each Fund’s expense ratio is rounded to two decimal points) The net expense ratios set forth above reflect this limitation, while the gross expense ratios do not. The International Value Fund II’s, Value Fund’s and Buybacks . Dividends + Value Fund’s performance data shown above would have been lower had fees and expenses not been waived and/or reimbursed during certain periods.
** Formerly known as Tweedy, Browne Worldwide High Dividend Yield Value Fund prior to May 27, 2026.
Please refer to footnotes (1) through (7) at the end of this commentary for descriptions of the Funds’ indexes.
The Funds do not impose any front-end or deferred sales charges. The expense ratios shown above reflect the inclusion of acquired fund fees and expenses (i.e., fees charged by the Adviser on Affiliated Funds and the fees/expenses attributable to investing cash balances in money market funds) and may differ from those shown in the Funds’ financial statements.
While US-based AI-related companies drove market returns during the quarter, we were heartened to see the advance broaden well beyond the “Magnificent Seven” to include smaller-cap companies. Non-US equities also moved up, but trailed their US counterparts. Against this increasingly “risk on” backdrop, the Tweedy Browne Funds acquitted themselves as one might expect, producing strong absolute returns of between 6.27% and 7.20% for the quarter, while underperforming their respective international and global benchmarks. Year-to-date results for the Tweedy Funds remained very strong as well, with our flagship International Value Fund and the Value Fund outpointing their primary benchmarks through June 30, producing returns of 10.65% and 11.07%, respectively. The International Value Fund II-Currency Unhedged and the newly named Buybacks . Dividends + Value Fund (formerly the Worldwide High Dividend Yield Value Fund prior to May 27, 2026), finished the year-to-date period up 8.84%% and 4.51%, respectively, but trailed their primary benchmarks.
While we are pleased with the financial results of our Funds and global equity markets in the first half of this year, we would be remiss if we did not share our increasing concern about rapidly rising equity valuations in the face of stubbornly persistent inflation and rising interest rates. The over-arching enthusiasm about all things AI-related, and the increasing dominance of a small group of mega-cap technology companies, have unleashed “animal spirits” which cannot help but conjure up memories of the late 1990s, lest we forget the late Barton Biggs’ admonition in March of 2000 that “even monkeys fall from trees.”
*The performance data shown above represents past performance and is not a guarantee of future results. Investment return and principal value of an investment will fluctuate so that an investor’s shares, when redeemed, may be worth more or less than their original cost. Current performance may be higher or lower than the performance data quoted. Please click here (TBGVX), here (TBCUX), here (TWEBX), and here (TBHDX) to obtain performance data that is current to the most recent month-end.

… lest we forget the late Barton Biggs’ admonition in March of 2000 that “even monkeys fall from trees.”

Please note that the individual companies discussed herein were held in one or more of the Funds during the quarter ended June 30, 2026, but were not necessarily held in all four of the Funds. Please refer to the full commentary (beginning of page 7) for selected purchase and sale information during the quarter and the Notes (on page 15) for each Fund’s respective holdings in each of these companies as of June 30, 2026.
The “Magnificent 7,” which had been free cash flow generating machines, are now pouring billions upon billions of that free cash flow into expanding their AI “compute.” As to when this new investment leads to increases in earnings and free cash flow for these hyper-scalers is anyone’s guess. Nevertheless, equity markets remain enthusiastic about the prospects for this new technology, and in our view, more than reflect that enthusiasm. While it is easier to identify businesses increasing their revenues from massive investments in AI infrastructure than it is to predict which companies will likely benefit from AI-driven productivity gains, predicting the ultimate winners of this gold rush remains exceedingly difficult. For the most part, the bulk of these companies fail to meet our rigorous valuation criteria, and simply fall into the “too hard file.”
Financial institutions involved in financing the unprecedented AI capital expenditure also participated in the advance. Beyond AI-related lending, the sector benefited from improving fundamentals, particularly in Europe and Japan, where several banks were among the quarter’s strongest performers. Given that banks are inherently leveraged enterprises, we have typically avoided taking positions in those that are not financially strong. For the most part, this has kept us out of many European banks, and the result has been a significant underweight in our Fund portfolios which has weighed on relative performance of late.
In terms of what worked and didn’t work for our Fund portfolios during the quarter, from a sector perspective, IT and Industrials were among the Funds’ most significant contributors, including strong performance from Samsung Electronics, Computacenter, Safran, and DHL. Many of the Fund’s Consumer Staples holdings, including Nestlé and Heineken, were solid contributors on an absolute and relative basis. Conversely, Energy holdings contributed negatively as optimism around the cease-fire in the US/Iran conflict led to a decline in oil prices. Also, as previously mentioned, the Funds’ under-weighted positions relative to the Index in Financials and IT holdings detracted.
At the industry level, technology hardware companies, led by Samsung; beverage holdings, including Heineken and Diageo; banks including Singapore based United Overseas Bank, National Bank of Canada, and Korea based Hana Financial, as well as chemicals companies led by Japanese chemical companies, Fuso Chemical and ADEKA, were among the top contributors. Detracting industries included oil and gas holding TotalEnergies, gas utilities such as Rubis, and containers & packaging companies, including Winpak. Defense companies Rheinmetall and BAE Systems detracted as well.
From a geographic standpoint, South Korea and Japan were among the more significant contributors, supported by strong performance in holdings such as Samsung Electronics and Fuso Chemical. The Funds’ holdings in the UK also contributed positively in local currency terms, led by Computacenter and Johnson Service Group. In contrast, Finland, Hong Kong, and China detracted from returns.
At the individual security level, Samsung Electronics was again a standout performer, as strong demand for semi-conductors led to record-breaking operating profits. Santec Holdings, a relatively new holding in the international funds that produces optical equipment, benefited from continued investor enthusiasm surrounding AI infrastructure investment. Safran, DHL Group, and Aalberts were also among the more significant contributors. TotalEnergies was a top detractor, as was Kemira, a water treatment company, which declined due to increasing costs and inflation pressure. Hang Lung Group, Subaru Corp, and Fresenius were also among the top detractors in the quarter.
Currency movements were a modest headwind during the quarter. The US dollar strengthened against most major currencies, including the euro, Canadian dollar, and Swiss franc, with more pronounced declines in the South Korean won, Japanese yen, and Swedish krona. As expected, the currency hedged Funds were largely insulated from these effects, while the unhedged Funds experienced some negative translation impact.
A list of selected newly established positions, including additions, sales, and trims of existing positions for each Fund, is included with each Fund’s portfolio page, in the full commentary (beginning of page 7).
While valuations remain elevated in global equity markets, particularly in the US, we continue to uncover opportunities. Among the new positions established during the quarter were Capgemini, the French business and information technology consultant, and bioMérieux, the French, family-controlled biotechnology company that produces in vitro diagnostics including software, instrument systems and chemical reagents used by clinical laboratories to test for infectious diseases. At purchase, we believed these two companies were trading at a discount to a conservative estimate of their intrinsic value, were financially strong, and had runways for future growth. We also added to the Funds’ positions in Autotrader, Berkeley Group Holdings, and Nihon Nohyaku, among others, at what we believe are still discounted prices.
On the sell side, we took advantage of strength in the chemicals industry by trimming or liquidating the Funds’ position in Fuso Chemical, Sol SpA, and Kuraray. We decided to move on from our position in Sopra Steria, which has been a disappointment. Several portfolio holdings which had reached or neared our estimate of intrinsic value were trimmed, including Nestle, Novartis, Roche, Embotelladora Andina, and Samsung Electronics. We continued to trim the positions in Megacable and Hang Lung Group, which have not met our expectations to this point, in order deploy cash in what we believe to be better opportunities.
As mentioned last quarter, the investment strategy for the newly renamed Tweedy, Browne Buybacks . Dividends + Value Fund (formerly the Worldwide High Dividend Yield Value Fund), was modestly adjusted to emphasize investment in companies that pay an attractive dividend and/or have initiated buybacks of their shares, when those shares are trading at discounts to underlying value — including undervaluation based on proprietary combinations of various numerical value oriented investment characteristics, a value score, and qualitative assessments. The Fund no longer requires an above average dividend.
The expanded mandate opened the door for several new purchases that would not have qualified under the former mandate. This included the establishment of new positions in Alliance Resource Partners, Autotrader Group, Berkeley Group Holdings, Capgemini, Euronet Worldwide Inc, Koito Manufacturing Co, Krafton Inc, Metropolitan Bank & Trust Company, Sega Sammy Holdings Inc, Suzuken Co Ltd, Western Union, Winpak Ltd, and Zoetis, Inc. All of these companies have either announced, or are implementing buyback programs in their shares, and at purchase were trading at quantitatively cheap relative valuations. While several of these companies pay a dividend, none met the requirement of the prior strategy of an above average dividend.
Welcoming Allie Roberts. We are pleased to welcome Allison Roberts to our team. Allie has joined us as the Chief Compliance Officer for both our firm and our Funds, where she will lead our compliance department. Allie brings a wealth of experience from the asset management industry. Prior to joining Tweedy, she worked as the CCO of a registered broker-dealer and registered investment adviser, Grayscale. Additionally, she worked as a compliance professional at Horizon Kinetics, where her experience ran the gamut from ETFs to mutual funds and to hedge funds. Please join us in welcoming Allie to the Tweedy family.
ETF share classes. As we have previously reported, our application for exemptive relief to establish ETF share classes for our Funds was approved by the Securities and Exchange Commission (“SEC”), and we are working diligently to help make these new share classes available to shareholders sometime before yearend. In June, we filed a Preliminary Prospectus and Statement of Additional Information for these new share classes which are currently under review by the SEC. We remain excited about the opportunity, and we will continue to keep you apprised of our progress.
Change of name/strategy in the Worldwide High Dividend Value Fund to the Buybacks . Dividends + Value Fund. As a reminder, as of May 27, 2026, the former Worldwide High Dividend Value Fund’s investment strategy was modestly adjusted to emphasize investment in companies that pay an attractive dividend and/or have initiated buybacks of their shares, when those shares are trading at discounts to underlying value — including undervaluation based on proprietary combinations of various numerical investment characteristics, a value score, and qualitative assessments. The Fund no longer requires an above average dividend. This focus on the dividend and/or buyback components of shareholder yield coupled with undervaluation is consistent with a change in the Fund’s name to the Tweedy, Browne . Buybacks . Dividends + Value Fund. The impetus for this modest change in strategy was proprietary empirical work evidencing a return advantage over time for stocks trading at significant discounts to conservative estimates of intrinsic value where the company was engaged in buying back its shares in the open market and ultimately retiring them. We are excited about this modest change in focus, and what it could mean for the future prospects of our Fund. Should you have any questions or concerns regarding this adjustment in the Fund’s strategy, please do not hesitate to reach out. Click here to see the supplement that was filed with the US Securities and Exchange Commission on March 27, 2026, for more details.
As we mentioned in the introduction of this report, while we are delighted with the financial progress that equity markets and our Funds continue to make, and are heartened by the broadening of the rally, we believe there are also reasons for caution, a few of which we have highlighted below:
While the warning signs above are concerning, we’re not suggesting you abandon sensibly valued publicly traded equities. Today’s market resembles the period before the 2000 tech bubble: technology, media and telecommunications companies traded at highly elevated valuations, but the broader market, for the most part, stayed reasonably valued both in the US and abroad. We see a similar pattern now, with equity returns concentrated in a smaller group of highly valued US technology companies while other sectors, particularly non-US technology, while somewhat elevated, continue to trade at reasonable valuations. History may not repeat, but it often rhymes.
Our Funds remain well positioned by issue, country, sector and industry, with growing exposure to smaller and mid-cap companies. On the whole, these holdings offer much more attractive valuations than US tech giants. Insider buying and corporate buybacks continue to provide valuable signals of undervaluation and the prospect for stronger relative returns. If our worries prove out, and we do get a comeuppance in global equity markets, we believe our Funds should hold up better, and may gain ground on our benchmark indices. If, on the other hand, animal spirits continue to provide exuberant support for equity prices, we’ll likely still participate, even if we don’t outperform.
We remain humbled by your investment in our Funds and thank you for your continued trust and confidence.
Roger R. de Bree, Andrew Ewert, Frank H. Hawrylak, Jay Hill, Thomas H. Shrager, John D. Spears, Robert Q. Wyckoff, Jr. | Investment Committee* | Tweedy, Browne Company LLC
July 2026
* Each member of the Investment Committee is a current investor in one or more of the Funds.
(1) Indexes are unmanaged, and the figures for the indexes shown include reinvestment of dividends and capital gains distributions and do not reflect any fees or expenses. Investors cannot invest directly in an index.
(2) The MSCI EAFE Index is a free float-adjusted, market capitalization weighted index that is designed to measure the equity market performance of developed markets, excluding the US and Canada. The MSCI EAFE Index (in USD) reflects the return of the MSCI EAFE Index for a US dollar investor. The MSCI EAFE Index (Hedged to USD) consists of the results of the MSCI EAFE Index hedged 100% back into US dollars and accounts for interest rate differentials in forward currency exchange rates. Results for each index are inclusive of dividends and net of foreign withholding taxes.
(3) Inception dates for the International Value Fund, International Value Fund II, Value Fund and Buybacks . Dividend + Yield Value Fund are June 15, 1993, October 26, 2009, December 8, 1993, and September 5, 2007, respectively. Prior to 2004, information with respect to the MSCI EAFE and MSCI World Indexes used was available at month end only; therefore, the since-inception performance of the MSCI EAFE Indexes quoted for the International Value Fund reflects performance from May 31, 1993, the closest month end to the International Value Fund’s inception date, and the since inception performance of the MSCI World Index quoted for the Value Fund reflects performance from November 30, 1993, the closest month end to the Value Fund’s inception date. For International Value Fund, information with respect to the Morningstar Foreign Stock Fund Average or the Foreign Stock Fund Average (see note 6 below) are available at month end only; therefore, the closest month end to the inception date of the International Value Fund, May 31, 1993, was used.
(4) The S&P 500/MSCI World Index (Hedged to USD) is a combination of the S&P 500 Index and the MSCI World Index (Hedged to USD), linked together by Tweedy, Browne, and represents the performance of the S&P 500 Index for the periods 12/08/93 – 12/31/06 and the performance of the MSCI World Index (Hedged to USD) beginning 01/01/07 and thereafter (beginning December 2006, the Fund was permitted to invest more significantly in non-US securities). The S&P 500 Index is a market capitalization weighted index composed of 500 widely held common stocks that assumes the reinvestment of dividends. The index is generally considered representative of US large capitalization stocks.
(5) The MSCI World Index is a free float-adjusted market capitalization weighted index that is designed to measure the equity market performance of developed markets. The MSCI World Index (in USD) reflects the return of this index for a US dollar investor. The MSCI World Index (Hedged to USD) consists of the results of the MSCI World Index with its foreign currency exposure hedged 100% back into US dollars. The index accounts for interest rate differentials in forward currency exchange rates. The MSCI World High Dividend Yield Index reflects the performance of equities in the MSCI World Index (excluding REITs) with higher dividend income and quality characteristics than average dividend yields that are both sustainable and persistent. The index also applies quality screens and reviews 12-month past performance to omit stocks with potentially deteriorating fundamentals that could force them to cut or reduce dividends. The MSCI World High Dividend Yield Index (in USD) reflects the return of the MSCI World High Dividend Yield Index for a US dollar investor. Results for each index are inclusive of dividends and net of foreign withholding taxes.
(6) Since September 30, 2003, the Foreign Stock Fund Average is calculated by Tweedy, Browne based on data provided by Morningstar and reflects average returns or portfolio turnover rates of all mutual funds in the Morningstar Foreign Large-Value, Foreign Large-Blend, Foreign Large-Growth, Foreign Small/Mid-Value, Foreign Small/Mid-Blend, and Foreign Small/Mid-Growth categories. Funds in these categories typically invest in international stocks and devote no more than 20% of assets to US equity markets. These funds may or may not be hedged to the US dollar, which will affect reported returns. References to “Foreign Stock Funds” or the “Foreign Stock Fund Average” that predate September 30, 2003 are references to Morningstar’s Foreign Stock Funds and Foreign Stock Fund Average, respectively, while references to Foreign Stock Funds and the Foreign Stock Fund Average for the period beginning September 30, 2003 refer to Foreign Stock Funds and the Foreign Stock Fund Average as calculated by Tweedy, Browne.
(7) Since April 28, 2017, the Global Stock Fund Average is calculated by Tweedy, Browne based on data provided by Morningstar, and reflects average returns or portfolio turnover rates of all mutual funds in the Morningstar Global Large Stock (including Global Large Value, Global Large Growth, and Global Large Blend categories) and Global Small/Mid Stock categories. Prior to April 28, 2017, the Global Stock Fund Average was calculated by Morningstar. Funds in these categories typically invest in stocks throughout the world while maintaining a percentage of their assets (normally 20% – 60%) invested in US stocks. These funds may or may not be hedged to the US dollar, which will affect reported returns. References to “Global Stock Funds” or the “Global Stock Fund Average” that predate April 28, 2017 are references to Morningstar’s Global Stock Funds and Global Stock Fund Average, respectively, while references to Global Stock Funds and the Global Stock Fund Average for the period beginning April 28, 2018 refer to the Global Stock Funds and Global Stock Fund Average as calculated by Tweedy, Browne.
The Funds are actively managed, unlike the indexes, and consist of securities that vary widely from those included in the indexes in terms of portfolio composition, country and sector allocations, and other metrics. Hedged indexes are included to illustrate how the stocks that are components of the hedged indexes would have performed in their local currencies for a US dollar investor. The hedged indexes are fully nominally hedged on a monthly basis, whereas the International Value Fund and the Value Fund hedge their perceived currency exposure only where practicable. Tweedy, Browne applies a different hedging methodology than the hedged indexes. Index results are shown for illustrative purposes only.
The performance results reflected above are over the course of many years and reflect multiple market cycles and varying geopolitical, market and economic conditions. Past performance is no guarantee of future results.
Content reproduced from Morningstar is ©2026 Morningstar, Inc. All Rights Reserved. The information contained herein: (1) is proprietary to Morningstar and/or its content providers; (2) may not be copied or distributed; and (3) is not warranted to be accurate, complete or timely. Neither Morningstar nor its content providers are responsible for any damages or losses arising from any use of this information. Past performance is no guarantee of future results.
As of June 30, 2026, the International Value Fund, International Value Fund II, Value Fund, and Buybacks . Dividend + Yield Value Fund had each invested the following percentages of its net assets, respectively, in the following portfolio holdings:
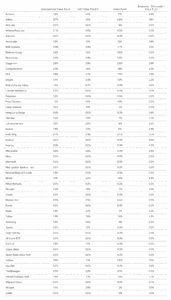
The above listed portfolio holdings reflect the Funds’ investments on the date indicated and may not be representative of the Funds’ current or future holdings. Selected Purchases & Sales illustrate some or all of the largest purchases and sales made for each Fund during the preceding quarter and may not include all purchases and sales. Some “undisclosed” names may have been withheld where disclosure may be disadvantageous to a Fund’s accumulation or disposition program.
All investing involves the risk of loss, including the loss of principal. Current and future portfolio holdings are subject to risk. The securities of small, less well-known companies may be more volatile than those of larger companies. In addition, investing in foreign securities involves additional risks beyond the risks of investing in securities of US markets. These risks which are more pronounced in emerging markets, include economic and political considerations not typically found in US markets, including currency fluctuation, political uncertainty and different financial standards, regulatory environments, and overall market and economic factors. Force majeure events such as pandemics and natural disasters are likely to increase the risks inherent in investments and could have a broad negative impact on the world economy and business activity in general. Value investing involves the risk that the market will not recognize a security’s intrinsic value for a long time, or that a security thought to be undervalued may in fact be appropriately priced when purchased. Dividends are not guaranteed, and a company currently paying dividends may cease paying dividends at any time. Diversification does not guarantee a profit or protect against a loss in declining markets.
Although the practice of hedging perceived foreign currency exposure, where practicable, utilized by the International Value Fund and Value Fund reduces the risk of loss from exchange rate movements, it also reduces the ability of the Funds to gain from favorable exchange rate movements when the US dollar declines against the currencies in which the Funds’ investments are denominated and may impose costs on the Funds. As a result of practical considerations, fluctuations in a security’s prices, and fluctuations in currencies, a Fund’s hedges are expected to approximate, but will generally not equal, the Fund’s perceived foreign currency risk.
Stocks and bonds are subject to different risks. In general, stocks are subject to greater price fluctuations and volatility than bonds and can decline significantly in value in response to adverse issuer, political, regulatory, market or economic developments. Unlike stocks, if held to maturity, bonds generally offer to pay both a fixed rate of return and a fixed principal value. Bonds are subject to interest rate risk (as interest rates rise bond prices generally fall), the risk of issuer default, issuer credit risk, and inflation risk, although US Treasuries are backed by the full faith and credit of the US government.
Investors should refer to the prospectus for a description of risk factors associated with investments in securities which may be held by the Funds. Investing involves the risk of loss, including the loss of principal. There is no assurance that a Fund will achieve its investment objective.
This commentary contains opinions and statements on investment techniques, economics, market conditions and other matters. There is no guarantee that these opinions and statements will prove to be correct, and some of them are inherently speculative. None of them should be relied upon as statements of fact. The views expressed herein represent the opinions of Tweedy, Browne Company LLC as of the date of this commentary, are not intended as a forecast or a guarantee of future results, or investment advice and are subject to change without notice.
Tweedy, Browne International Value Fund, Tweedy, Browne International Value Fund II – Currency Unhedged, Tweedy, Browne Value Fund, and Tweedy, Browne . Buybacks . Dividends + Value Fund are distributed by AMG Distributors, Inc., Member FINRA/SIPC.
This material must be preceded or accompanied by a current prospectus for Tweedy, Browne Fund Inc. Click here for a copy of the Funds’ prospectus. You should consider the Funds’ investment objectives, risks, charges and expenses carefully before investing. The prospectus contains this and other information about the Funds. The prospectus should be read carefully before investing.
You are navigating from Tweedy U.S. Funds to {{ TARGET_SITE }}.