While the equity market rally has broadened somewhat over the last year, more economically sensitive small- and mid-capitalization companies have rebounded, and non-US equities have seen a resurgence in performance.


All in all, we were delighted with the progress our Funds made over the past quarter and year, and continue to be encouraged by the resurgence of international equities.
Tweedy, Browne Funds Commentary, Q4 2025Global equity markets continued their unrelenting advance during the 4th quarter with most major market indices once again finishing the year at or around their all-time highs. While the equity market rally has broadened somewhat over the last year, more economically sensitive small- and mid-capitalization companies have rebounded, and non-US equities have seen a resurgence in performance. Even so, a relatively small group of familiar US technology companies continued to account for an outsized share of global index returns.
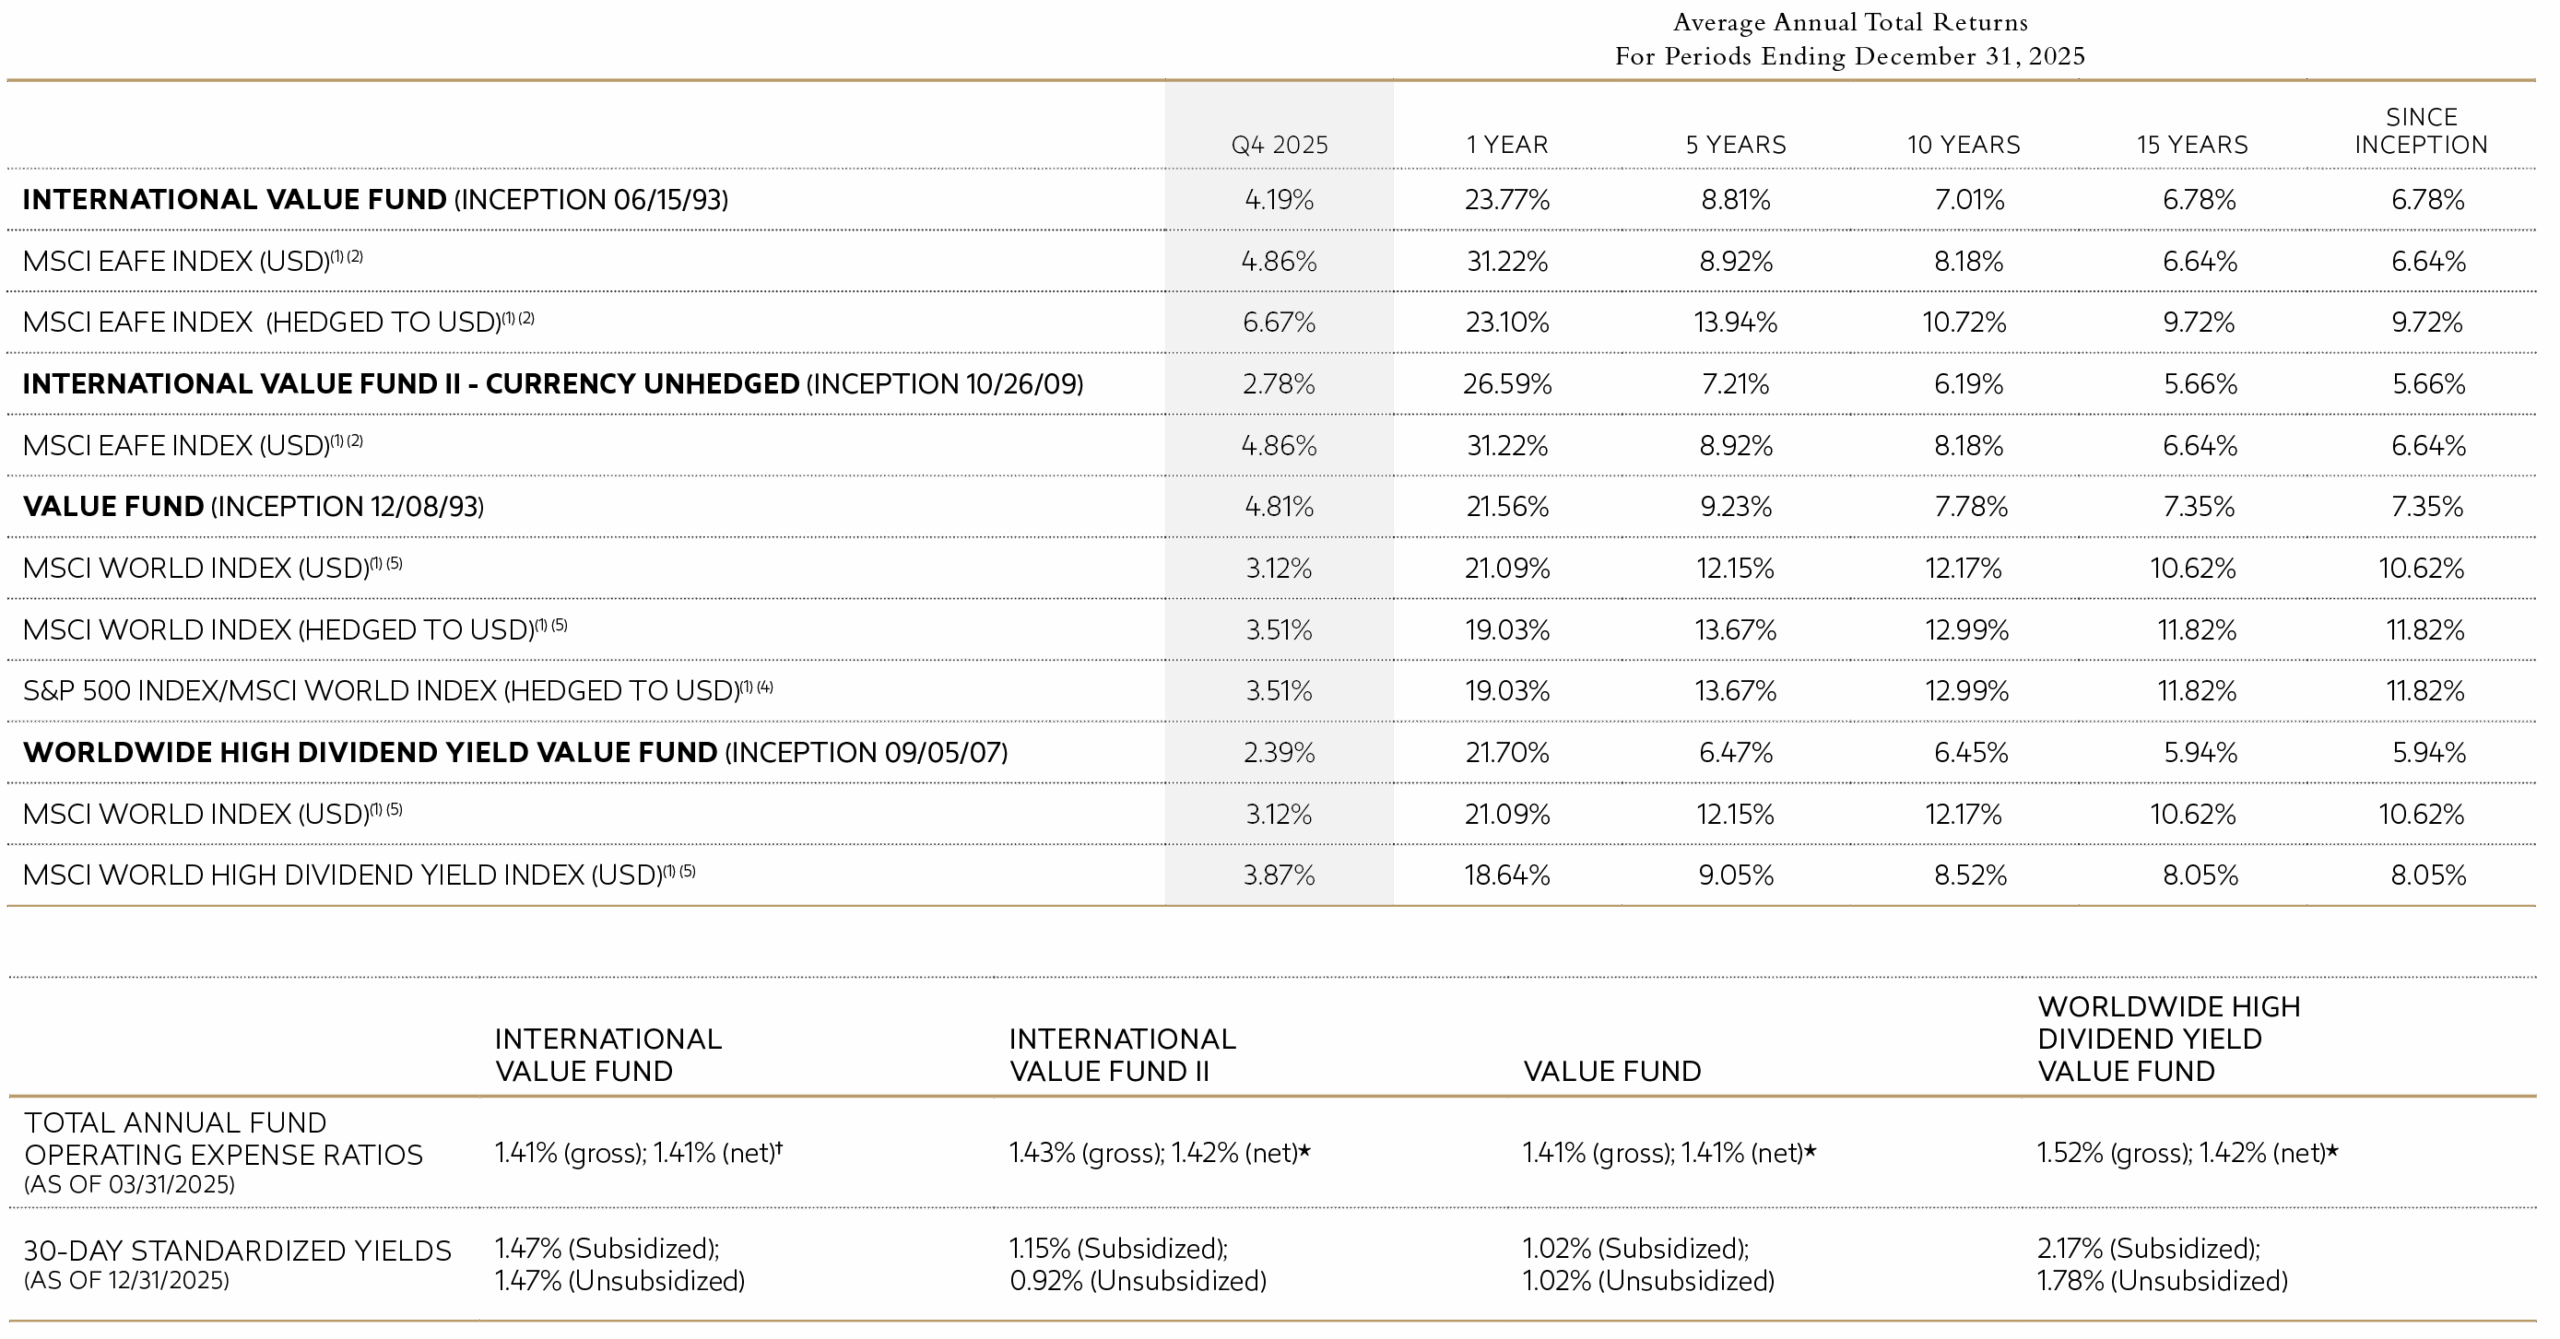
The performance data shown above represents past performance and is not a guarantee of future results. Investment return and principal value of an investment will fluctuate so that an investor’s shares, when redeemed, may be worth more or less than their original cost. Current performance may be higher or lower than the performance data quoted. Please click here (TBGVX), here (TBCUX), here (TWEBX), and here (TBHDX) to obtain performance data that is current to the most recent month-end.
† Tweedy, Browne has voluntarily agreed, effective May 22, 2020 through at least July 31, 2026, to waive the International Value Fund’s fees whenever the Fund’s average daily net assets (“ADNA”) exceed $6 billion. Under the arrangement, the advisory fee payable by the Fund is as follows: 1.25% on the first $6 billion of the Fund’s ADNA; 0.80% on the next $1 billion of the Fund’s ADNA (ADNA over $6 billion up to $7 billion); 0.70% on the next $1 billion of the Fund’s ADNA (ADNA over $7 billion up to $8 billion); and 0.60% on the remaining amount, if any, of the Fund’s ADNA (ADNA over $8 billion). The performance data shown above would have been lower had fees not been waived during certain periods. The Adviser has agreed to waive the Fund’s management fee to the extent of any management fee charged in connection with the portfolio of the Fund’s assets that are allocated to an Affiliated Fund (as defined in the Fund’s Prospectus). Such waiver shall continue until January 31, 2027.
* Tweedy, Browne has voluntarily agreed, effective December 1, 2017 through at least July 31, 2026, to waive a portion of the International Value Fund II’s, the Value Fund’s and the Worldwide High Dividend Yield Value Fund’s investment advisory fees and/or reimburse a portion of each Fund’s expenses to the extent necessary to keep each Fund’s expense ratio in line with the expense ratio of the International Value Fund. (For purposes of this calculation, each Fund’s acquired fund fees and expenses, brokerage costs, interest, taxes and extraordinary expenses are disregarded, and each Fund’s expense ratio is rounded to two decimal points.) The net expense ratios set forth above reflect this limitation, while the gross expense ratios do not. The International Value Fund II’s, Value Fund’s and Worldwide High Dividend Yield Value Fund’s performance data shown above would have been lower had fees and expenses not been waived and/or reimbursed during certain periods.
Please refer to footnotes (1) through (7) at the end of this commentary for descriptions of the Funds’ indexes.
The Funds do not impose any front-end or deferred sales charges. The expense ratios shown above reflect the inclusion of acquired fund fees and expenses (i.e., the fees and expenses attributable to investing cash balances in money market funds) and may differ from those shown in the Funds’ financial statements.
In this continued “risk on” environment, all four Tweedy Funds made solid financial progress during the 4th quarter and produced However, only the Tweedy, Browne Value Fund outperformed its primary benchmark, for both the quarter and calendar year measurement periods. Calendar year results for the Tweedy Funds varied between 21.56% and 26.59%. While the Funds’ absolute results were positive, relative comparisons were mixed for the calendar year:
For much of the year, the US dollar weakened against most major currencies, which diluted absolute returns for Tweedy’s foreign currency hedged Funds, International Value and Value, and helped to boost returns for our two unhedged Funds, International Value II and Worldwide High Dividend Yield Value. That said, during the 4th Quarter, the US dollar regained a bit of its previous strength against many foreign currencies including the Japanese Yen, the Korean Won, the British Pound, and the Euro, among others.
All in all, we were delighted with the progress our Funds made over the past quarter and year, and continue to be encouraged by the resurgence of international equities. Despite the outperformance of non-US equities this past year, the gap in valuation between US and non-US equities still remains quite significant and should serve us well going forward given the non-US-centric postures of our fund portfolios.
*The performance data shown above represents past performance and is not a guarantee of future results. Investment return and principal value of an investment will fluctuate so that an investor’s shares, when redeemed, may be worth more or less than their original cost. Current performance may be higher or lower than the performance data quoted. Please visit www.tweedy.com to obtain performance data which is current to the most recent month end.

While the equity market rally has broadened somewhat over the last year, more economically sensitive small- and mid-capitalization companies have rebounded, and non-US equities have seen a resurgence in performance.
Please note that the individual companies discussed herein were held in one or more of the Funds during the quarter ended December 31, 2025, but were not necessarily held in all four of the Funds. Please refer to the full commentary (beginning of page 6) for selected purchase and sale information during the quarter and the Notes (on page 16) for each Fund’s respective holdings in each of these companies as of December 31, 2025.
Several broad themes influenced returns across the Funds during the quarter. Our Funds’ health care holdings, which included exposure to pharmaceutical and biotechnology companies, added meaningfully to returns. Holdings such as Roche, Novartis, and Ionis Pharmaceuticals benefited from new drug approvals, steady and growing earnings, and business models that continue to generate cash through a wide range of economic conditions. These are not fast-growing businesses, but they have proven to be durable, and we believe they remain sensibly valued relative to their long-term prospects.
Selected technology-related companies held across several of our funds contributed for the quarter, particularly established franchises such as Samsung Electronics and Alphabet (Google). While the shares of both companies soared upward in price during the year, we believe they remain reasonably valued relative to their near-term growth prospects.
Our industrials were mixed and, on balance, faced a modest headwind. Some holdings performed well, but returns were held back by weaker results in several more cyclical oriented businesses. CNH Industrial detracted across the Funds, reflecting investors’ continued concerns about the downturn of the “Ag” cycle and its impact on end-market demand. CNH remains significantly undervalued in our view, and we are adding to our position opportunistically.
Defense-related holdings such as BAE Systems and Rheinmetall, which had been standout performers for much of the year, fell back a bit in the 4th Quarter. While these businesses currently benefit from secular growth in defense spending around the world, share prices have moved ahead of underlying fundamentals, and positions over the past few quarters.
From a geographic perspective, holdings in Switzerland, Japan, and parts of continental Europe, were the most significant contributors to our Funds’ results, in part reflecting renewed interest by investors in more economically sensitive European equities, and continued interest in Japan’s resurgence. The United Kingdom, whose equity market remains one of the most undervalued in the world in our view, was a notable detractor across several Funds, driven by stock-specific weakness during the quarter.
From a market capitalization perspective, larger, more established holdings contributed more consistently during the quarter, while smaller-cap positions produced mixed results. This contrasts with the 3rd Quarter when small and medium sized companies led returns.
The Worldwide High Dividend Yield Value Fund shared many of these attribution themes but with a slightly different emphasis. Financials and industrials contributed meaningfully, consistent with the Fund’s dividend-focused orientation, while exposure to certain materials-related holdings detracted. FMC Corp. was a notable laggard during the quarter.
A list of selected newly established positions, including additions, sales, and trims of existing positions for each Fund, is included in the full commentary, beginning on page 6.
Portfolio activity was somewhat more subdued during the quarter, understandably, as market valuations continued their advance. We did begin building a position in a new holding, Sysmex Corporation, a global leader in diagnostic equipment, with a large installed base and recurring revenue characteristics that we believe support long-term value creation.
The Funds also added to existing holdings where valuations became more compelling. We took advantage of a pricing opportunity and added to CNH Industrial, which is now a top 10 holding in all four funds. We added to our position in Sodexo, the French food services and facilities-management company we began buying in the third quarter. The purchases were made at prices we believe are still attractive, and Sodexo is now a significant position in all four funds. We also added to CVS Group in the Quarter, a business that provides veterinary services in the UK & Australia. Forced selling, which resulted from a listing venue change, provided an attractive pricing opportunity to increase our position. Other additions to existing positions included Shoei, the Japanese motorcycle helmet manufacturer, and Johnson Service Group, the UK-based industrial laundry business. Both holdings remain attractively valued.
On the sales side, Brenntag, DB Insurance, and Mitsubishi Gas Chemical were sold reflecting valuation considerations, and to make room for more attractively valued holdings.
We also trimmed several larger holdings, including Roche, Novartis, Safran, and TotalEnergies, whose stock prices had approached underlying intrinsic value. While we believe these companies will continue to compound their value, we felt it was prudent to reduce their portfolio position size somewhat.
Prospect of New ETF Share Classes
In mid-December, the Securities and Exchange Commission preliminarily approved our application for exemptive relief to establish ETF share classes for the Tweedy Browne Funds. While there is considerable work to be done to establish the infrastructure necessary to accommodate these new share classes, in our view, the approval of mutual fund ETF share classes is a potential game-changer for the traditional mutual fund industry. We are excited about the opportunity to offer our shareholders a choice when it comes to investing in our funds, and we will be sure to keep you apprised of our progress moving forward.
Despite the imposition of potentially punishing tariffs, the decline in so called US exceptionalism, armed conflict in Gaza and the Middle East, and a stubbornly persistent level of inflation leading to the rise of an affordability crisis, capital markets just kept on “keeping on” over the last year. This market enthusiasm has led to high, if not excessive, valuations across most asset categories, particularly publicly traded US equities. It’s hard to know exactly what is at the root of this exuberance, but history would suggest that it is some combination of benign economic conditions and “new era” thinking on the part of investors. If it was the emergence of the internet in the mid 1990s, today it most likely is excitement around the prospects for artificial intelligence and its ability to dramatically impact productivity. But as Jonathan Levin and Taylor Tyson recently pointed out in a rather compelling Bloomberg article, “Even the most profound technological revolutions aren’t one-way streets to prosperity.” We suspect this time is not likely to be any different.
Making market calls is impossible, and certainly not the focus of our work at Tweedy, Browne, but we’d be remiss if we did not bring these worrisome signs to the attention of our clients. We cannot know when, but at some point the popular acronym “FOMO” will likely be replaced by “FOPCL,” or “fear of permanent capital loss.” Unless human nature has changed, when that day comes there will once again be hell to pay for a while in capital markets. In the interim, we take comfort in knowing that our Funds remain well positioned in what we believe to be financially sound enterprises in the parts of the world where company stock prices are more than collateralized by underlying intrinsic value.
Ultimately, as we have postulated in past letters, we believe fervently that a diversified portfolio of well-capitalized, competitively advantaged companies purchased at attractive valuations offers the best defense against market uncertainty and resultant volatility. If the past is prologue, that should continue to serve us, and our investors, well over time.
We remain humbled by your investment in our Funds and thank you for your continued trust and confidence.
Roger R. de Bree, Andrew Ewert, Frank H. Hawrylak, Jay Hill, Thomas H. Shrager, John D. Spears, Robert Q. Wyckoff, Jr. | Investment Committee* | Tweedy, Browne Company LLC
January 2026
* Each member of the Investment Committee is a current investor in one or more of the Funds.
NOTES
(1) Indexes are unmanaged, and the figures for the indexes shown include reinvestment of dividends and capital gains distributions and do not reflect any fees or expenses. Investors cannot invest directly in an index.
(2) The MSCI EAFE Index is a free float-adjusted, market capitalization weighted index that is designed to measure the equity market performance of developed markets, excluding the US and Canada. The MSCI EAFE Index (in USD) reflects the return of the MSCI EAFE Index for a US dollar investor. The MSCI EAFE Index (Hedged to USD) consists of the results of the MSCI EAFE Index hedged 100% back into US dollars and accounts for interest rate differentials in forward currency exchange rates. Results for each index are inclusive of dividends and net of foreign withholding taxes.
(3) Inception dates for the International Value Fund, International Value Fund II, Value Fund and Worldwide High Dividend Yield Value Fund are June 15, 1993, October 26, 2009, December 8, 1993, and September 5, 2007, respectively. Prior to 2004, information with respect to the MSCI EAFE and MSCI World Indexes used was available at month end only; therefore, the since-inception performance of the MSCI EAFE Indexes quoted for the International Value Fund reflects performance from May 31, 1993, the closest month end to the International Value Fund’s inception date, and the since inception performance of the MSCI World Index quoted for the Value Fund reflects performance from November 30, 1993, the closest month end to the Value Fund’s inception date. For International Value Fund, information with respect to the Morningstar Foreign Stock Fund Average or the Foreign Stock Fund Average (see note 6 below) are available at month end only; therefore, the closest month end to the inception date of the International Value Fund, May 31, 1993, was used.
(4) The S&P 500/MSCI World Index (Hedged to USD) is a combination of the S&P 500 Index and the MSCI World Index (Hedged to USD), linked together by Tweedy, Browne, and represents the performance of the S&P 500 Index for the periods 12/08/93 – 12/31/06 and the performance of the MSCI World Index (Hedged to USD) beginning 01/01/07 and thereafter (beginning December 2006, the Fund was permitted to invest more significantly in non-US securities). The S&P 500 Index is a market capitalization weighted index composed of 500 widely held common stocks that assumes the reinvestment of dividends. The index is generally considered representative of US large capitalization stocks.
(5) The MSCI World Index is a free float-adjusted market capitalization weighted index that is designed to measure the equity market performance of developed markets. The MSCI World Index (in USD) reflects the return of this index for a US dollar investor. The MSCI World Index (Hedged to USD) consists of the results of the MSCI World Index with its foreign currency exposure hedged 100% back into US dollars. The index accounts for interest rate differentials in forward currency exchange rates. The MSCI World High Dividend Yield Index reflects the performance of equities in the MSCI World Index (excluding REITs) with higher dividend income and quality characteristics than average dividend yields that are both sustainable and persistent. The index also applies quality screens and reviews 12-month past performance to omit stocks with potentially deteriorating fundamentals that could force them to cut or reduce dividends. The MSCI World High Dividend Yield Index (in USD) reflects the return of the MSCI World High Dividend Yield Index for a US dollar investor. Results for each index are inclusive of dividends and net of foreign withholding taxes.
DEFINITIONS
The Buffett Indicator, also known as the Market Capitalization-to-GDP ratio, is a valuation metric that assesses the price of the stock market relative to a country’s GDP. It’s calculated by dividing the total market value of a country’s publicly-traded stocks by its GDP.
The Shiller CAPE Index, also known as the cyclically adjusted price-to-earnings ratio, is a stock valuation metric that compares a stock’s current price to its average inflation-adjusted earnings over the previous 10 years. The CAPE index is used to assess whether a stock or market is overvalued or undervalued, and to forecast future returns.
Content reproduced from Morningstar is ©2026 Morningstar, Inc. All Rights Reserved. The information contained herein: (1) is proprietary to Morningstar and/or its content providers; (2) may not be copied or distributed; and (3) is not warranted to be accurate, complete or timely. Neither Morningstar nor its content providers are responsible for any damages or losses arising from any use of this information. Past performance is no guarantee of future results.
As of December 31, 2025, the International Value Fund, International Value Fund II, Value Fund, and Worldwide High Dividend Yield Value Fund had each invested the following percentages of its net assets, respectively, in the following portfolio holdings: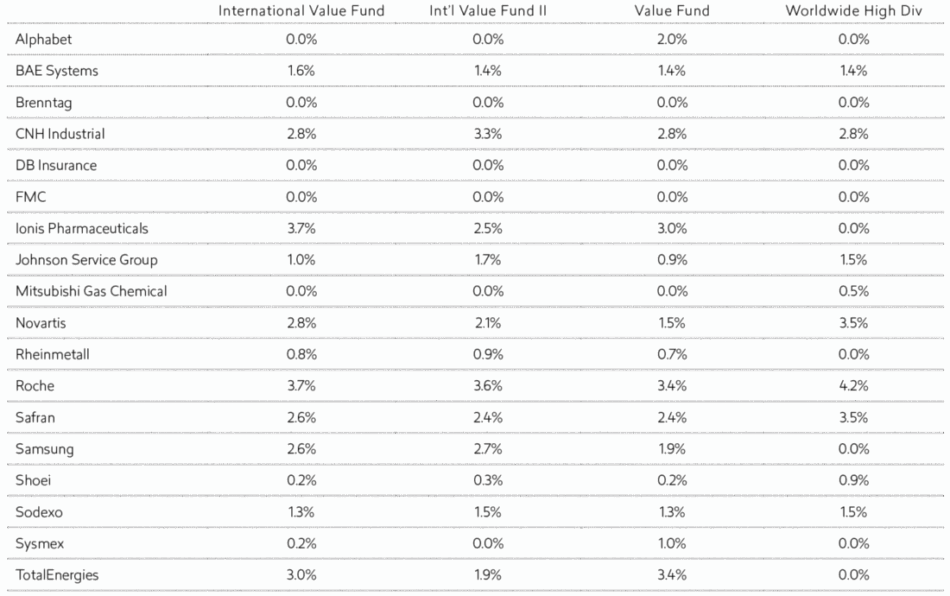 The above listed portfolio holdings reflect the Funds’ investments on the date indicated and may not be representative of the Funds’ current or future holdings. Selected Purchases & Sales illustrate some or all of the largest purchases and sales made for each Fund during the preceding quarter and may not include all purchases and sales. Some “undisclosed” names may have been withheld where disclosure may be disadvantageous to a Fund’s accumulation or disposition program.
All investing involves the risk of loss, including the loss of principal. Current and future portfolio holdings are subject to risk. The securities of small, less well-known companies may be more volatile than those of larger companies. In addition, investing in foreign securities involves additional risks beyond the risks of investing in securities of US markets. These risks which are more pronounced in emerging markets, include economic and political considerations not typically found in US markets, including currency fluctuation, political uncertainty and different financial standards, regulatory environments, and overall market and economic factors. Force majeure events such as pandemics and natural disasters are likely to increase the risks inherent in investments and could have a broad negative impact on the world economy and business activity in general. Value investing involves the risk that the market will not recognize a security’s intrinsic value for a long time, or that a security thought to be undervalued may in fact be appropriately priced when purchased. Dividends are not guaranteed, and a company currently paying dividends may cease paying dividends at any time. Diversification does not guarantee a profit or protect against a loss in declining markets.
Although the practice of hedging perceived foreign currency exposure, where practicable, utilized by the International Value Fund and Value Fund reduces the risk of loss from exchange rate movements, it also reduces the ability of the Funds to gain from favorable exchange rate movements when the US dollar declines against the currencies in which the Funds’ investments are denominated and may impose costs on the Funds. As a result of practical considerations, fluctuations in a security’s prices, and fluctuations in currencies, a Fund’s hedges are expected to approximate, but will generally not equal, the Fund’s perceived foreign currency risk.
Stocks and bonds are subject to different risks. In general, stocks are subject to greater price fluctuations and volatility than bonds and can decline significantly in value in response to adverse issuer, political, regulatory, market or economic developments. Unlike stocks, if held to maturity, bonds generally offer to pay both a fixed rate of return and a fixed principal value. Bonds are subject to interest rate risk (as interest rates rise bond prices generally fall), the risk of issuer default, issuer credit risk, and inflation risk, although US Treasuries are backed by the full faith and credit of the US government.
Investors should refer to the prospectus for a description of risk factors associated with investments in securities which may be held by the Funds. Investing involves the risk of loss, including the loss of principal. There is no assurance that a Fund will achieve its investment objective.
This commentary contains opinions and statements on investment techniques, economics, market conditions and other matters. There is no guarantee that these opinions and statements will prove to be correct, and some of them are inherently speculative. None of them should be relied upon as statements of fact. The views expressed herein represent the opinions of Tweedy, Browne Company LLC as of the date of this commentary, are not intended as a forecast or a guarantee of future results, or investment advice and are subject to change without notice.
Tweedy, Browne International Value Fund, Tweedy, Browne International Value Fund II – Currency Unhedged, Tweedy, Browne Value Fund, and Tweedy, Browne Worldwide High Dividend Yield Value Fund are distributed by AMG Distributors, Inc., Member FINRA/SIPC.
This material must be preceded or accompanied by a current prospectus for Tweedy, Browne Fund Inc. Click here for a copy of the Funds’ prospectus. You should consider the Funds’ investment objectives, risks, charges and expenses carefully before investing. The prospectus contains this and other information about the Funds. The prospectus should be read carefully before investing.
You are navigating from Tweedy U.S. Funds to {{ TARGET_SITE }}.